Note
Click here to download the full example code
Amputing with a custom probability function
Create complete data.
import numpy as np

n = 10000
rng = np.random.default_rng()
X = rng.standard_normal((n, 2))
Define custom probability function.
# purely for demonstrative type hints
from pyampute import ArrayLike

# Must produce values between 0 and 1
def min_max_scale(X: ArrayLike) -> ArrayLike:
    X_abs = np.abs(X)
    return (X_abs - X_abs.min()) / (X_abs.max() - X_abs.min())
Define some patterns.
Include the custom score to probability function in whichever pattern(s) you desire.
Here we’ll create 3 patterns.
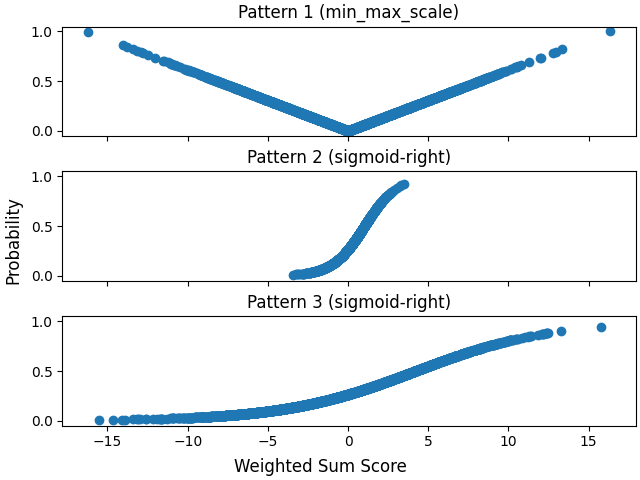
Note that the first and last pattern have the same weights but use different score_to_probability_func s.
The first pattern introduces missingness to feature 0, and the latter two introduce missingness to feature 1.
my_incomplete_vars = [np.array([0]), np.array([1]), np.array([1])]
my_freqs = np.array((0.3, 0.2, 0.5))
my_weights = [np.array([4, 1]), np.array([0, 1]), np.array([4, 1])]
my_score_to_probability_funcs = [min_max_scale, "sigmoid-right", "sigmoid-right"]
my_prop = 0.3

patterns = [
    {
        "incomplete_vars": incomplete_vars,
        "freq": freq,
        "weights": weights,
        "score_to_probability_func": score_to_probability_func,
    }
    for incomplete_vars, freq, weights, score_to_probability_func in zip(
        my_incomplete_vars, my_freqs, my_weights, my_score_to_probability_funcs
    )
]
Run ampute.
from pyampute import MultivariateAmputation

ma = MultivariateAmputation(prop=my_prop, patterns=patterns)
incomplete_data = ma.fit_transform(X)
We expect about 30% of rows to be missing values
np.isnan(incomplete_data).any(axis=1).mean() * 100
Out:
26.82
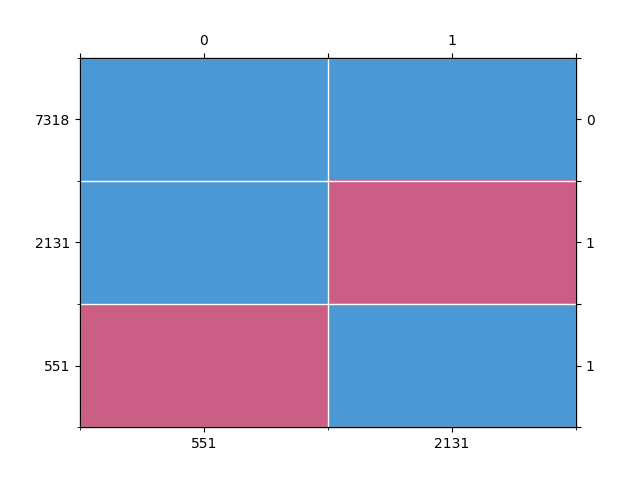
from pyampute.exploration.md_patterns import mdPatterns

mdp = mdPatterns()
pattern = mdp.get_patterns(incomplete_data)

Out:
/home/dav/research/pyampute/pyampute/exploration/md_patterns.py:120: FutureWarning: The frame.append method is deprecated and will be removed from pandas in a future version. Use pandas.concat instead.
  group_values = group_values.append(colsums, ignore_index=True)
Plot probabilities per pattern against the weighted sum scores per pattern. Note that Pattern 1 and Pattern 3 have the same weights.
import matplotlib.pyplot as plt

fig, ax = plt.subplots(
    len(patterns), 1, constrained_layout=True, sharex=True, sharey=True
)
for pattern_idx in range(len(patterns)):
    ax[pattern_idx].scatter(
        ma.wss_per_pattern[pattern_idx], ma.probs_per_pattern[pattern_idx]
    )
    score_to_prob_func = patterns[pattern_idx]["score_to_probability_func"]
    name = (
        score_to_prob_func
        if isinstance(score_to_prob_func, str)
        else score_to_prob_func.__name__
    )
    ax[pattern_idx].set_title(f"Pattern {pattern_idx + 1} ({name})")
# supxlabel requires matplotlib>=3.4.0
fig.supxlabel("Weighted Sum Score")
fig.supylabel("Probability")
plt.show()

Cases when you might not achieve desired amount of missingness
Here we rerun the amputation process but with only one pattern,
and that pattern uses a custom score_to_probability_func.
patterns = [
    {"incomplete_vars": [np.array([0])], "score_to_probability_func": min_max_scale}
]
ma = MultivariateAmputation(prop=my_prop, patterns=patterns)
incomplete_data = ma.fit_transform(X)

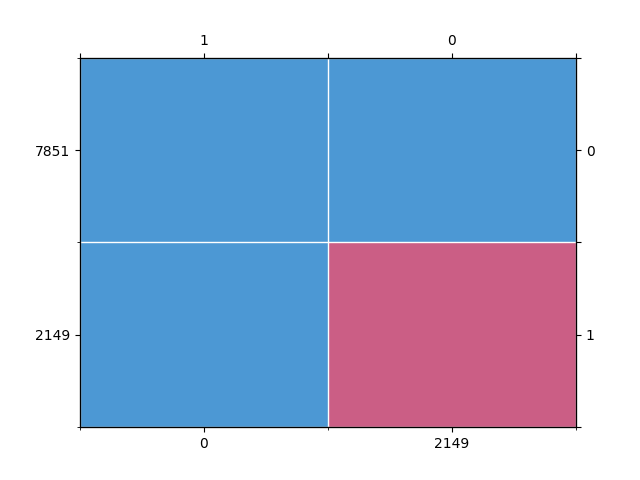
mdp = mdPatterns()
pattern = mdp.get_patterns(incomplete_data)

Out:
/home/dav/research/pyampute/pyampute/exploration/md_patterns.py:120: FutureWarning: The frame.append method is deprecated and will be removed from pandas in a future version. Use pandas.concat instead.
  group_values = group_values.append(colsums, ignore_index=True)
We expect about 30% of rows to be missing values.
np.isnan(incomplete_data).any(axis=1).mean() * 100
Out:
21.490000000000002
We expected 30% of rows to be missing values but when we only have one
pattern with a custom score_to_probability_func we don’t see that result.
This is expected behavior.
For the sigmoid functions, we use prop to influence the proportion
of missingness by shifting the sigmoid function accordingly.
However, for a given custom probability we cannot know ahead of time
how to adjust the function in order to produce the desired proportion
of missingness.
In the previous example, we achieved nearly 30% missingness due to the
second and third patterns using the sigmoid score_to_probability_func.
If you would like to use a custom probability function is it your responsibility to adjust the function to produce the desired amount of missingness. You can calculate the expected proportion of missingness following the procedure in Appendix 2 of Schouten et al. (2018).
Total running time of the script: ( 0 minutes 0.336 seconds)